top of page
My Experience with Microsoft Excel
I’ve been using Excel for over 15 years, and for the past decade, I’ve worked with it at an advanced level. I earned my Microsoft Office Specialist certification 10 years ago, and since then, I’ve never stopped learning. Thanks to Microsoft 365, Excel keeps evolving, offering new ways to solve problems and streamline tasks. There’s always something new to discover.

These days, rather than just learning new formulas, I focus on solving real-world problems. For me, it’s not about memorizing functions, it’s about knowing how to use the tool to create meaningful, practical results.
Excel is extremely powerful. While it's often used as a database or system, its real strength lies in calculations, automation, and how functions work together. Understanding cell references is also key. The ability to combine up to 55 formulas (enough if you ask me) in a single cell gives you an impressive level of flexibility. Excel may not always be the "right" tool for everything, but when it comes to fast, visual analysis, it’s hard to beat.
When Excel reaches its limits in terms of data volume or processing power, we can use other tools like Power Query, Power Pivot, or even Python to handle more complex tasks.
Why I Enjoy Using Excel
Excel alone doesn't create value. It’s how we use it, how we structure data, how we interpret it, and how we connect it to processes, that bring results. Sometimes the best solution is a simple function. Other times, it’s in how you organize your workbook or design a workflow. That’s what I enjoy most: using Excel as an extension of analytical thinking.
And of course, there’s always more to learn.
Beyond the technical side, what I love is using Excel to create custom solutions. Here are some key areas I work with regularly, along with practical notes and ideas:
Formulas and Functions
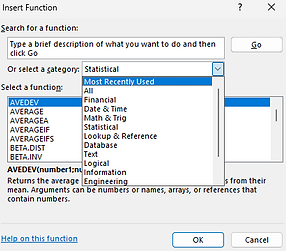
Excel offers a massive variety: basic math, conditional logic, statistics, text handling, lookups, and more.
Some of my favorites:
VLOOKUP is still widely used, even though XLOOKUP improves on it in many ways.
FILTER is amazing, especially when combined with TRANSPOSE.
Before XLOOKUP came along, I used to rely heavily on INDEX + MATCH.
There are many useful functions we don’t use every day, but it’s good to know they exist, or have a personal “Excel bible” to refer to. AI can now help generate formulas, but it’s still up to us to know what output we want and how to validate it.
Keyboard Shortcuts
They make everything faster and smoother. My go to’s include:
Ctrl + Z / Ctrl + Y (undo/redo)
Ctrl + Shift + L (toggle filters)
Ctrl + A, Ctrl + F, Ctrl + T (select all, find, create table)
Ctrl + Shift + arrow keys, Ctrl + Space, Shift + Space (navigation and selection)
Ctrl + D to copy down, and a recent discovery: Ctrl + R to copy from the left.

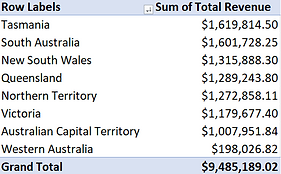
Pivot Tables and Pivot Charts
Great for quick summaries and identifying patterns. Many of my reports are built on top of pivot tables, either directly or using data extracted from them.
Custom Charts
With some creativity, you can build custom visuals beyond standard chart types, ideal for communicating a specific message.


Conditional Formatting
Perfect for highlighting values, trends, or exceptions without manual filtering. You can even create your own rules based on what matters most.

Macros
Macros help automate repetitive tasks and save time. A common misconception is that macros can fully automate entire workflows, while they help a lot, they have limits. For more complex automation, you might need VBA or another programming language.
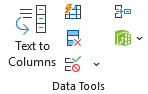
Subtotals and Data Tools
Tools like remove duplicates, text to-columns, or data validation help clean and structure your work more efficiently.
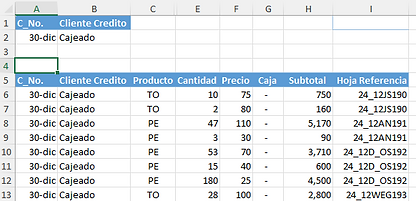
Quick Data Insights
Sometimes, just selecting a range of cells and seeing the sum, average, or count gives you fast, useful insight, no formulas needed.

Formula Auditing (Precedents and Dependents)
These tools are super helpful when working with large or complex models. They make it easier to debug or trace logic step by step.


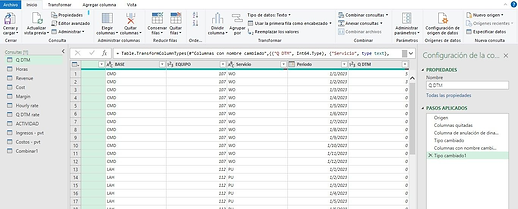
Data Loading and Transformation
Power Query is perfect for importing, cleaning, and shaping data without changing the original file. For smaller datasets, it’s also possible to restructure and clean manually to suit your needs.
Filters and Advanced Filtering
Sorting and filtering, even basic, is one of the most useful features in Excel. And when you need more control, advanced filters can handle more complex criteria.
Forecasting
Excel’s forecast tool isn’t the most precise, but it can still be a good starting point for trends or quick estimates.
Excel’s "Intelligence"
Sometimes Excel seems to know what you’re trying to do before you even finish, it’s intuitive in ways that are easy to overlook.
A Blank Canvas for Ideas
One of the things I enjoy most is using Excel like a sketchpad. Whether I’m testing an idea, building a framework, or exploring a scenario, it’s flexible, open, and full of possibilities. Again, creativity makes all the difference.
The Real Value: Putting It All Together
What really makes the difference isn’t just knowing a formula or shortcuts, it’s being able to combine different skills to solve real problems. That takes more than technical knowledge. It takes curiosity, creativity, critical thinking, and a solution-oriented mindset.
Excel alone doesn't create value. It’s how we use it, how we structure data, how we interpret it, and how we connect it to processes, that bring results. Sometimes the best solution is a simple function. Other times, it’s in how you organize your workbook or design a workflow. That’s what I enjoy most: using Excel as an extension of analytical thinking.
And of course, there’s always more to learn.
bottom of page